Xenium to SpatialData zarr#
This is the flagship conversion: turning a raw 10x Xenium output directory into a SpatialData zarr store, with an aligned H&E image, tissue segmentation, and Visium-like pseudo-spots at whatever sizes you need.
What you need: a Xenium output directory (see Downloading Xenium data) containing experiment.xenium and the associated transcript/cell/boundary files, optionally with an aligned H&E image and alignment CSV. Runtime: minutes to tens of minutes depending on dataset size and n_jobs; the zarr store is written incrementally, so memory stays bounded even for large panels.
from pathlib import Path

import dask
import spatialdata as sd

from spatialrefinery import xenium_to_spatialdata, xenium_to_spatialdata_zip

# Xenium's dask-backed transcript tables are large; disable dask's query planner
# to avoid excessive memory use while building the task graph for a full panel.
dask.config.set({"dataframe.query-planning": False})
<dask.config.set at 0x107fd4e60>
Parameters#
Edit these to point at your own data. DATASET_PATH is a single Xenium output directory (one biospecimen); OUTPUT_PATH is where the zarr store (and, later, the zip archive) will be written.
DATASET_PATH = Path(
    "/Users/rushin.gindra/Documents/Research/SpatialProjects/Phoenix/datasets/tenx/Xenium_V1_hKidney_cancer_section"
)
OUTPUT_PATH = Path("/Users/rushin.gindra/Documents/Research/SpatialProjects/Phoenix/datasets/example_zarr_files")
OUTPUT_NAME = "Xenium_V1_hKidney_cancer"

OUTPUT_PATH.mkdir(parents=True, exist_ok=True)
Convert to a zarr store#
xenium_to_spatialdata loads the transcripts, cell and nucleus boundaries, and (if available) the aligned H&E image with its own tissue segmentation, writing the result to OUTPUT_PATH/OUTPUT_NAME.zarr. Passing spot_sizes creates pseudo-spots in the same pass – note that spots are only created when both create_spots=True and spot_sizes is a non-empty list; leaving spot_sizes=None (the default) skips spot creation entirely even with create_spots=True.
zarr_path = xenium_to_spatialdata(
    dataset_path=DATASET_PATH,
    output_path=OUTPUT_PATH,
    output_name=OUTPUT_NAME,
    include_aligned_image=True,
    create_spots=True,
    spot_sizes=[55, 100],
    overlap=0.06,
    values="transcripts",
    n_jobs=8,
)
zarr_path
INFO     Processing Xenium dataset: Xenium_V1_hKidney_cancer_section
INFO     Loading Xenium data...
INFO     Writing base data to
         /Users/rushin.gindra/Documents/Research/SpatialProjects/Phoenix/datasets/example_zarr_files/Xenium_V1_hKid
         ney_cancer.zarr...
INFO     Adding aligned H&E image...
INFO     H&E image added successfully
INFO     H&E Tissue Contours added successfully
INFO     Creating pseudo-spots iteratively...
INFO     Processing spot size: 55µm
INFO     Created 10502 hexagonal pseudo-spots of size 55µm with 6.0% overlap
INFO     Updating sdata with shape element for spots of size 55µm...
INFO     Updating sdata with table element for spots of size 55µm...
INFO     Processing spot size: 100µm
INFO     Created 3366 hexagonal pseudo-spots of size 100µm with 6.0% overlap
INFO     Updating sdata with shape element for spots of size 100µm...
INFO     Updating sdata with table element for spots of size 100µm...
INFO     Successfully created
         /Users/rushin.gindra/Documents/Research/SpatialProjects/Phoenix/datasets/example_zarr_files/Xenium_V1_hKid
         ney_cancer.zarr
PosixPath('/Users/rushin.gindra/Documents/Research/SpatialProjects/Phoenix/datasets/example_zarr_files/Xenium_V1_hKidney_cancer.zarr')
Inspect the result#
Reading the store back with spatialdata.read_zarr shows every element it contains – images, labels, points, shapes, and tables:
sdata = sd.read_zarr(zarr_path)
sdata
SpatialData object, with associated Zarr store: /Users/rushin.gindra/Documents/Research/SpatialProjects/Phoenix/datasets/example_zarr_files/Xenium_V1_hKidney_cancer.zarr
├── Images
│     ├── 'he_image': DataTree[cyx] (3, 27323, 8832), (3, 13661, 4416), (3, 6830, 2208)
│     └── 'morphology_mip': DataTree[cyx] (1, 10346, 36943), (1, 5173, 18471), (1, 2586, 9235), (1, 1293, 4617), (1, 646, 2308)
├── Labels
│     ├── 'cell_labels': DataTree[yx] (10346, 36943), (5173, 18471), (2586, 9235), (1293, 4617), (646, 2308)
│     └── 'nucleus_labels': DataTree[yx] (10346, 36943), (5173, 18471), (2586, 9235), (1293, 4617), (646, 2308)
├── Points
│     └── 'transcripts': DataFrame with shape: (5115684, 10) (3D points)
├── Shapes
│     ├── 'cell_boundaries': GeoDataFrame shape: (56510, 1) (2D shapes)
│     ├── 'nucleus_boundaries': GeoDataFrame shape: (56510, 1) (2D shapes)
│     ├── 'spots_55um': GeoDataFrame shape: (10502, 3) (2D shapes)
│     ├── 'spots_100um': GeoDataFrame shape: (3366, 3) (2D shapes)
│     └── 'tissue_contours': GeoDataFrame shape: (3501, 2) (2D shapes)
└── Tables
      ├── 'spots_55um_table': AnnData (10502, 377)
      ├── 'spots_100um_table': AnnData (3366, 377)
      └── 'table': AnnData (56510, 377)
with coordinate systems:
    ▸ 'global', with elements:
        he_image (Images), morphology_mip (Images), cell_labels (Labels), nucleus_labels (Labels), transcripts (Points), cell_boundaries (Shapes), nucleus_boundaries (Shapes), spots_55um (Shapes), spots_100um (Shapes), tissue_contours (Shapes)
import matplotlib.pyplot as plt
from spatialdata_plot.pl.utils import set_zero_in_cmap_to_transparent

sdata = sd.read_zarr(zarr_path)

fig, axs = plt.subplots(2, 1, figsize=(10, 12))

new_cmap = set_zero_in_cmap_to_transparent(cmap="viridis")
# # new_cmap = "viridis"
sdata.pl.render_images("he_image").pl.render_shapes(
    "tissue_contours", color="pink", fill_alpha=0.7, outline_width=1.0, outline_alpha=1.0, outline_color="red"
).pl.show(ax=axs[0])

sdata.pl.render_images("he_image").pl.render_shapes("spots_100um", color="TRAC", cmap=new_cmap, fill_alpha=0.7).pl.show(
    ax=axs[1]
)
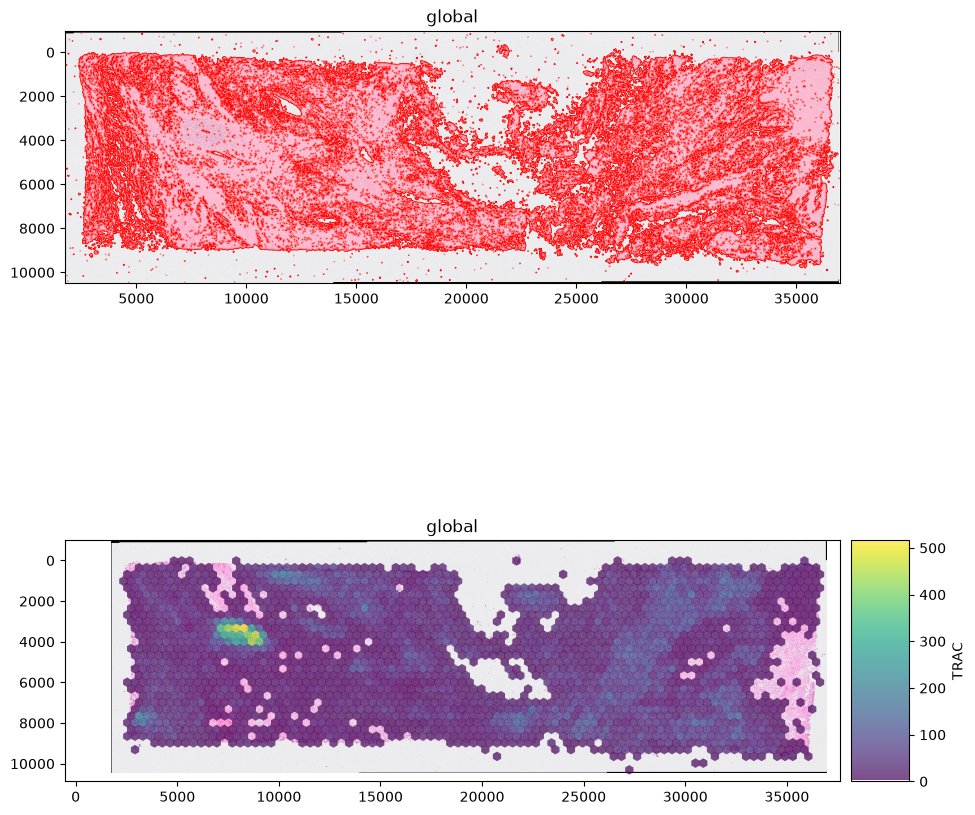
Pseudo-spot parameters#
spot_sizes– spot diameters in micrometers; onespots_<size>umshape element (and matchingspots_<size>um_tableAnnData) is created per size.overlap– fractional overlap between adjacent hexagonal spots (0.0= no overlap, i.e. spots tile the plane; higher values oversample the boundary between spots).values– what gets aggregated into each spot:"transcripts"(default) or"cell_boundaries".
Packaging for transfer: xenium_to_spatialdata_zip#
Same conversion, plus a zip archive of the zarr directory – convenient for moving a sample between machines. keep_zarr=False removes the unzipped directory afterwards to save disk space.
zip_path = xenium_to_spatialdata_zip(
    dataset_path=DATASET_PATH,
    output_path=OUTPUT_PATH,
    output_name=OUTPUT_NAME,
    include_aligned_image=True,
    create_spots=True,
    spot_sizes=[55, 100],
    overlap=0.06,
    n_jobs=8,
    keep_zarr=True,
    overwrite=False,
)
print(f"Created {zip_path} ({zip_path.stat().st_size / 1024**3:.2f} GB)")
Expected output structure#
example_study.zarr
├── Images
│   └── 'he_image': DataTree[cyx] (3, 27502, 14896), (3, 13751, 7448), (3, 6875, 3724)
├── Labels
│   ├── 'cell_labels': DataTree[yx] ...
│   └── 'nucleus_labels': DataTree[yx] ...
├── Points
│   └── 'transcripts': DataFrame with shape: (<Delayed>, 11) (3D points)
├── Shapes
│   ├── 'cell_boundaries': GeoDataFrame shape: (140702, 1) (2D shapes)
│   ├── 'cell_circles': GeoDataFrame shape: (140702, 2) (2D shapes)
│   ├── 'nucleus_boundaries': GeoDataFrame shape: (136531, 1) (2D shapes)
│   ├── 'spots_55um': GeoDataFrame shape: (6705, 3) (2D shapes)
│   └── 'spots_100um': GeoDataFrame shape: (2086, 3) (2D shapes)
└── Tables
    ├── 'spots_55um_table': AnnData (6705, 377)
    ├── 'spots_100um_table': AnnData (2086, 377)
    └── 'table': AnnData (140702, 377)
Batch processing multiple samples#
xenium_to_spatialdata is safe to call in a loop over a directory of Xenium output directories – each sample’s failure is independent of the others:
raw_data_dir = Path("/Users/rushin.gindra/Documents/Research/SpatialProjects/Phoenix/datasets/tenx")

for sample_dir in raw_data_dir.iterdir():
    if not sample_dir.is_dir():
        continue
    try:
        xenium_to_spatialdata(dataset_path=sample_dir, output_path=OUTPUT_PATH, n_jobs=8)
        print(f"Processed {sample_dir.name}")
    except Exception as e:  # noqa: BLE001 - one sample's failure must not abort the batch
        print(f"Failed to process {sample_dir.name}: {e}")
Running this as a script#
python scripts/xenium_to_zarr.py \
    --data-path raw_files \
    --biospecimen-id example_study \
    --output-path processed \
    --num-workers 8
What’s next#
Continue to Converting images to OME-TIFF to prepare a companion whole-slide image for pyramidal viewing.